Excel Analysis Toolpak

Running Statistical Data Analysis (EDA) using Excel Functions and Formulas.

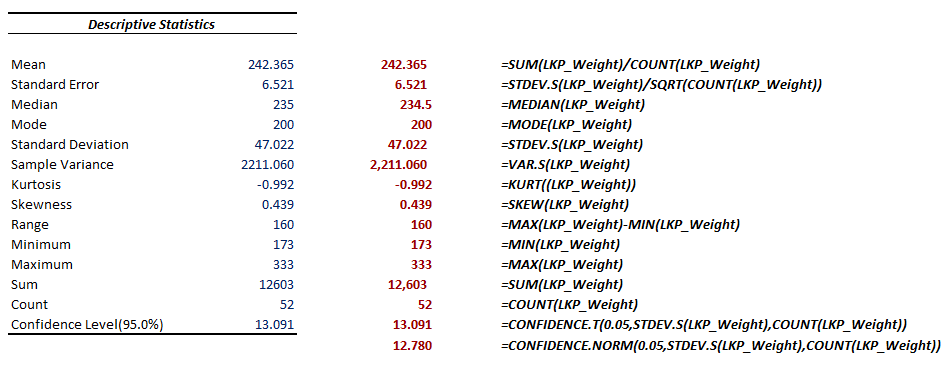
Back in August Microsoft made a momentous announcement of good ole’ Excel now supporting Python scripts (at least for those Office 365 subscribers who are part of the Beta Insider channel.) While this functionality brings an array of virtually unlimited possibilities to an already powerful tool, many analysts recognize that support for various statistical analysis techniques is one of the most promising areas to capitalize here. Having said that, some users do not realize that they don’t need to leverage sophisticated Python functions to conduct exploratory data analysis of their datasets – they can instead install Excel add-in called “Analysis Toolpak” to get them started on their statistical learning journey. In this post we will use this tool to analyze weight distribution of players appearing on the 2023/24 Chicago Bears Roster. These summary statistics will help us get a quick overview of this dataset, and in turn, make it easier for us to spot patterns and outliers. We will then recreate these capabilities via Excel functions and formulas.

Continue reading

XLOOKUP Function

I personally don’t know why it took this long for Microsoft Excel team to create XLOOKUP function. The fact that VLOOKUP is considered to be one of Excel’s most widely used functions reflects a strong demand in string look up tabulations. Surely, a multitude of VLOOKUP‘s limitations can be overcome with patience, helper columns, INDEX/MATCH, CHOOSE, OFFSET and other constructs. Yet, why would we use any workarounds, when we would rather utilize a more powerful function with multitude of applications? Meet, much anticipated XLOOKUP function, which was officially released to Office 365 subscribers in early February of this year. It offers a really long list of additional benefits; in today’s tutorial we will review 11 scenarios that take full advantage of the following XLOOKUP features:

  • LEFT lookup
  • Horizontal lookup
  • Multi-cell/array retrieval
  • Match based on wildcard conditions
  • Combination of Vertical AND Horizontal lookups
  • Lookup based on multiple criteria
  • Lookup in reverse order
  • Lookup for maximum/minimum values
  • Built-in Error Handling
  • Exact match by default
  • Flexible approximate match

Continue reading

How to pass an analytics job test – Part II – MS Excel.


How to pass an analytics job test - Part II - Microsoft Excel

          Even with the rise of use of R, Python, SAS and other more scientific analytical tools, Microsoft Excel remains the most popular data analysis tool. While we have gone over a solution for an analytics job test in SQL last month , you are much more likely to encounter a job test in Microsoft Excel for your next analytics opportunity. While I would personally argue that this particular test is actually better solved with SQL, the employer believes that the applicants instead need to apply their Excel skills to demonstrate their proficiency and acumen. As before, we should start by asking questions about the problem at hand and trying to get as much clarification as needed or state our assumptions. However, since spreadsheets are less forgiving from the presentation point of view than the databases, I would strongly recommend that we would also take a few minutes to format any workbooks provided by the prospective employer. Chances are they would recognize your level of professionalism by looking at clean and presentable file. Your stylistic preferences might be different, but as a minimum I would remove gridlines, add filters/format as tables larger datasets, freeze panes, and add at least one to two colors to the otherwise monochrome layout.

Continue reading

Microsoft Excel’s CONVERT Function.


CONVERT Excel Function

          Microsoft Excel is one of those great software applications that empowers us to do a lot of different things. You can create art masterpieces , convert digital photos into pixel worksheets , create a cool animation , build a flight simulator , or play a game of Tetris . If you don’t feel ambitious enough to write pages upon pages of VBA code, but still want to do something practical with the program, perhaps you want to learn how to perform different conversion calculations in Excel? In fact, CONVERSION function enables you to convert weight, distance, time, pressure, force, energy, power magnetism, temperature, volume, liquid measure, area, information, and speed measures from one unit to another. The later version of Microsoft Excel you are running the more conversions you can perform. If you are working in Excel 2003 or earlier, this function is not available on earlier versions of Microsoft Excel.

Continue reading