Utilizing Microsoft Azure ML add-in to perform Sentiment Analysis within an Excel worksheet.
Modern day business tasks require us to consume ever-increasing volume of data, which often comes in an unstructured form. Whether you’re looking to get to know your customer preferences better via a survey or seek to understand their opinions on the products you sell by scraping online product reviews, chances are you will need to find a way to efficiently analyze large stacks of text. You would be best served to take advantage of a sentiment analysis tool to undertake such a labor-intensive task. Last week I had a great opportunity to share my take on understanding the basics of Sentiment Analysis with the Strategic Finance Magazine. While I briefly covered fundamentals of textual preprocessing (tokenization, POS tagging, stop word removal, stemming, etc.) as well as various ways to perform actual analysis in this journal, those who are interested in an unabridged version of this article might want to head to my LinkedIn post on this subject for a more detailed overview.
More often than not we are expected to be fairly proficient in programming in R or Python to run sentiment analysis. In today’s blog I’d like go through an actual example of a sentiment analysis exercise, turning to our trusted friend – Microsoft Excel. Let’s say our goal is to sift through Amazon product reviews to better understand voice of customer for consumers purchasing Home Appliance products. Another term for sentiment analysis is opinion mining – this knowledge could, for example, help marketers better understand which product attributes are well-liked by consumers and as a result, determine which keywords or phrases to include on product display pages or ad copy; while also giving new ideas how to tweak the product features for the engineering department. Luckily, this data is already readily available for our downloading needs. For practical reasons I think that we could limit this dataset to 10,001 fairly randomly selected reviews (complements of Excel’s RAND function), after ensuring that key fields are not blank. We will utilize Azure Machine Learning Excel add in to perform actual sentiment analysis. Feel free to follow along and download my solution file. Let’s jump right in!
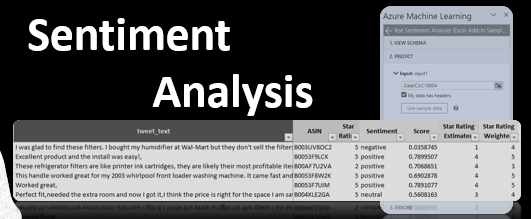
I will grab the reviewerName, reviewText, ASIN, and Start Rating fields from the Amazon file. All names are fairly self-explanatory with ASIN essentially being Amazon speak for the product id. To make this plug-in work, Microsoft wants us to rename the reviewText field into the tweet_text field (even though we are not analyzing tweets here), and call desired output fields: Score (for the numerical representation of the Sentiment score on a continuous scale from 0 to 1) where 0 stands for a very negative (lowest possible) and 1 being the most positive score among all other theoretically achievable scores. Sentiment will show a ternary representation of this score: negative (approaching 0), neutral (corresponding to the approximate score of 0.5) and positive (approaching 1.) Our data source tab should now look something like this:

Step 1: Install Azure Machine Learning add-in
Go to the Insert menu, click on Add-ins and search for ‘Azure Machine Learning‘ on the Office Add-in pop-up form, select corresponding add-in and click on the ‘Add‘ button:

Step 2: Select prediction service of interest
After the add-in is successfully installed, Excel displays Azure ML contextual pane at the right side of our worksheet. At the time of this writing Microsoft offers two machine learning services for us to choose from; as you might’ve guessed, we need to go with the ‘Text Sentiment Analysis‘ option:

Step 3: Run the prediction algorithm
At this point we need to specify where our data comes from and sit back to let Excel and Azure ML do its magic. Under the Input box, I selected all cells containing the text of our 10,001 reviews. I then informed Excel that this data includes headers and identified the first cell where the output results need to go. I also confirmed my understanding the the results will overwrite existing values and hit the ‘Predict’ button:

After a short wait we are presented with the results of this text analysis. At this time, unfortunately Microsoft treats this algorithm as a black box and does not share a lot of details behind its scoring logic. I’d imagine that the results represent lexicon-based sentiment measuring the polarity of individual words present in any given review, rather than contextual sentiment analysis (bank being a financial institution vs. a river edge.) Perhaps, over time, Microsoft will make its Copilot program a bit more transparent and we will be able to peak behind the curtain of all of its AI technology? In the meantime, I will share one way to attempt to make more sense of the results presented.

A prudent way to verify accuracy of this algorithm would be to go through a random small sample of the product review and assign a sentiment score based on our own judgement. We then could compare our score with the one provided by the sentiment analysis process. In our case, we could simplify the process further: instead of selecting a portion of reviews and assigning the sentiment score manually, we can take advantage of the Star Rating score consumers assigned to the product they reviewed. First, we would need to convert sentiment score into the star rating equivalent. In our case, sentiment score is stored in column G and I will use this formula to go through this task: =IFERROR(VLOOKUP($G4,LKP_Stars,2),0). This formula looks up a value of the score, based on the approximate match (one of the few scenarios when such default match in Excel is justified.) It also performs error checking and assigns a value of 0 to the cell when an error is flagged. Note, since we’re using the approximate match for our VLOOKUP function, our look up table (I called it LKP_Stars) needs to be sorted in ascending order:

We can borrow from the field of project management and attempt to create a more accurate star rating estimate rather than relying either on the star rating as per sentiment score calculations or using consumer-assigned rating. In fact, this situation might call for the three-point estimate, aka the Program Evaluation and Review Technique – PERT: (Optimistic scenario result + 4* Most likely scenario result + Pessimistic scenario results)/6. I will over-simplify this calculation even further by assuming that both optimistic and pessimistic scenarios are one and the same. Assuming that I consider the user-assigned star rating to be most likely scenario (column E) and star rating estimate from the previous calculation to be optimistic and pessimistic scenarios (column H), our Excel formula would like this: =IFERROR(ROUND((2*$H4 + 4*$E4)/6,0),0) where I would also round result to the next whole point (keep in mind that our reviewers effectively round their star ratings as well.)
We are almost done, now that we have a bit more trust in our data, we need to find a way to summarize our findings. I should pause here, and state the obvious: your results will vary – in fact there are some research papers tackling this subject, albeit without necessarily obtaining consensus on their findings. One such study, for example, finds that sentiment analysis score outperforms the star rating consumers assign to the product. Authors do list the product type and length of the survey playing a moderating role here. Given that Azure precludes us from understanding its scoring process I made a judgement call to err on the side of the consumer rather than the algorithm here.
Like with everything else data-related, best results are achieved with larger volumes. Instead of hyper-focusing on the sentiment of an individual product review, analysts might get a more accurate picture when aggregating such reviews. After all, a summary of a hundred or a thousand of reviews tells a better, and likely more consistent and reliable story than a sample consisting of reviews in single digits. It’s up to you to decide on a meaningful level of aggregation, which might be based on time-dimensions (weekly or monthly subtotals), brand, product category/line subtotals or regional cuts among others. In addition to accuracy, this exercise will also help us compare sentiment across desired groups (brands, product categories, customer cohorts, or regions.) Finally, this method will also lead to more efficient work and enable organizations to scale up their analytics process as needed.
One way to track sentiment is by looking at the share % of reviews with negative ratings (star ratings of 1 or 2.) Let’s say I decided to aggregate reviews by ASIN code (column D,) putting my results into the ‘Summary‘ tab, my formulas would be calculated as following:
- % of negative ratings based on consumer star ratings: =IFERROR(COUNTIFS(Data!$D$4:$D$10004,$C4,Data!$E$4:$E$10004,”<3″) /COUNTIF(Data!$D$4:$D$10004,$C4),0)
- % of negative ratings based on consumer star ratings estimate (per sentiment analysis): =IFERROR(COUNTIFS(Data!$D$4:$D$10004,$C4,Data!$H$4:$H$10004,”<3″) /COUNTIF(Data!$D$4:$D$10004,$C4),0)
- % of negative ratings based on weighted results (PERT formula): =IFERROR(COUNTIFS(Data!$D$4:$D$10004,$C4,Data!$I$4:$I$10004,”<3″) /COUNTIF(Data!$D$4:$D$10004,$C4),0)
These formulas count the number of reviews with a rating of 1 or 2 [negative polarity] within the range of cells specified and divides result by total number of reviews available.
As a reminder, you can follow along with these exercises by downloading the Excel version of my solution file.
What are your thoughts on Azure Machine Learning – did you get the results as expected? Do you agree with my approach of interpreting sentiment analysis results?