US COVID-19 Cases

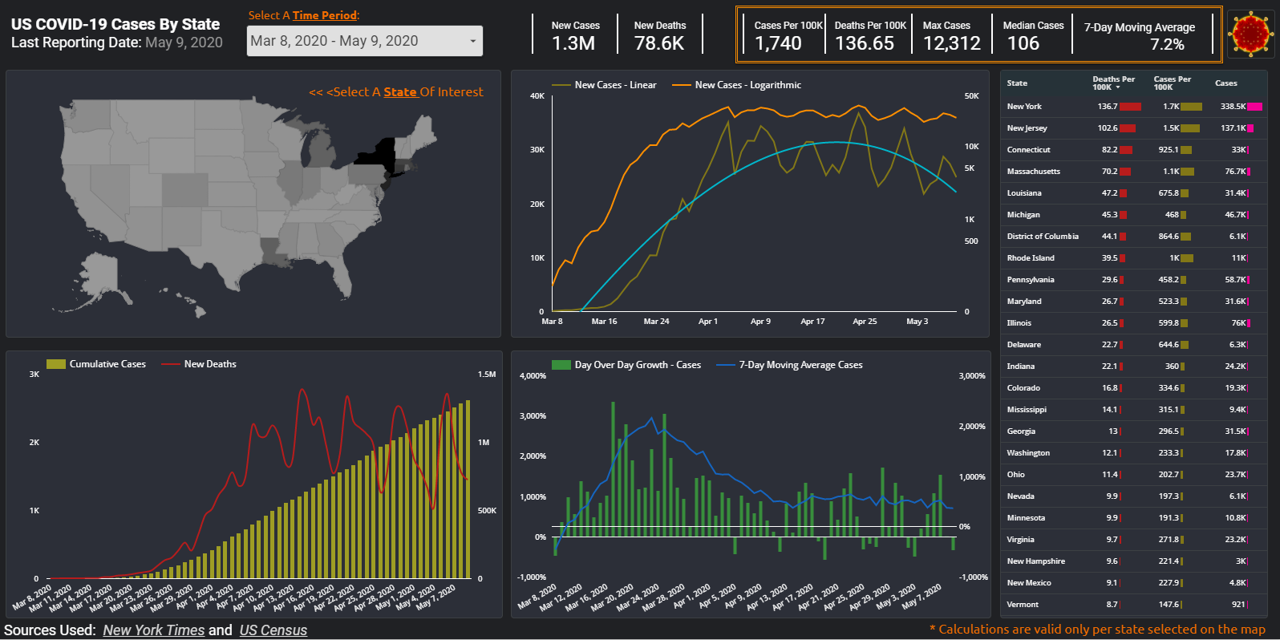
During these uncertain times, how can you make sense of the data tsunami being presented on the state of pandemic in US? For the last couple of months, many Americans found themselves checking the spread of COVID-19 cases on a daily basis. As most of US states went into shelter-in-place mode, resources like Johns Hopkins and 91-DIVOC became a daily refuge for those seeking to stay informed. In today’s post, we will work on creating our own version of a web-based, interactive and visually appealing COVID-19 dashboard using Google DataStudio. Doing so we will gain a better understanding of the data used, decide on the type of data we deem most relevant, and maintain control over the best ways to visualize such data to help our audience make most sense of it. In the process of building this data viz, we will utilize various objects and features of the mighty GDS application: Google Sheets connector, Calculated fields, Scorecard, Table, Geo Map, Line and Combo charts, Date range, Filter controls and recently released optional metrics – are some but not all features we will cover.

Continue reading

XLOOKUP Function

I personally don’t know why it took this long for Microsoft Excel team to create XLOOKUP function. The fact that VLOOKUP is considered to be one of Excel’s most widely used functions reflects a strong demand in string look up tabulations. Surely, a multitude of VLOOKUP‘s limitations can be overcome with patience, helper columns, INDEX/MATCH, CHOOSE, OFFSET and other constructs. Yet, why would we use any workarounds, when we would rather utilize a more powerful function with multitude of applications? Meet, much anticipated XLOOKUP function, which was officially released to Office 365 subscribers in early February of this year. It offers a really long list of additional benefits; in today’s tutorial we will review 11 scenarios that take full advantage of the following XLOOKUP features:

  • LEFT lookup
  • Horizontal lookup
  • Multi-cell/array retrieval
  • Match based on wildcard conditions
  • Combination of Vertical AND Horizontal lookups
  • Lookup based on multiple criteria
  • Lookup in reverse order
  • Lookup for maximum/minimum values
  • Built-in Error Handling
  • Exact match by default
  • Flexible approximate match

Continue reading

How to pass an analytics job test – Part II – MS Excel.


How to pass an analytics job test - Part II - Microsoft Excel

          Even with the rise of use of R, Python, SAS and other more scientific analytical tools, Microsoft Excel remains the most popular data analysis tool. While we have gone over a solution for an analytics job test in SQL last month , you are much more likely to encounter a job test in Microsoft Excel for your next analytics opportunity. While I would personally argue that this particular test is actually better solved with SQL, the employer believes that the applicants instead need to apply their Excel skills to demonstrate their proficiency and acumen. As before, we should start by asking questions about the problem at hand and trying to get as much clarification as needed or state our assumptions. However, since spreadsheets are less forgiving from the presentation point of view than the databases, I would strongly recommend that we would also take a few minutes to format any workbooks provided by the prospective employer. Chances are they would recognize your level of professionalism by looking at clean and presentable file. Your stylistic preferences might be different, but as a minimum I would remove gridlines, add filters/format as tables larger datasets, freeze panes, and add at least one to two colors to the otherwise monochrome layout.

Continue reading

How to pass an analytics job test – Part I – SQL.


How to pass an analytics job test - Part I - SQL

          With the demand in data analytics professionals growing stronger than ever, recruiters find themselves in a peculiar position of having to screen hundreds of potential, seemingly qualified candidates. Some firms turned to the proven selection tool: pre-employment skills assessments; and analytics-related tests are on the rise, especially for the junior level industry positions. No tests are the same, but most are designed with the sole purpose of gauging candidate’s cognitive ability to understand the problem at hand and having the technical know-how to implement a working solution. Two types of analytics tests that my students shared involved using either: Microsoft Excel or SQL language. Most of relational databases can be queried using a dialect of SQL, and as such, knowledge of SQL is as essential for a data analytics professional, as their excellent communications skills. In this post we will go through an example of a SQL job test, while in the next article we would focus on an Excel problem.

Continue reading