Running Statistical Data Analysis (EDA) using Excel Functions and Formulas.
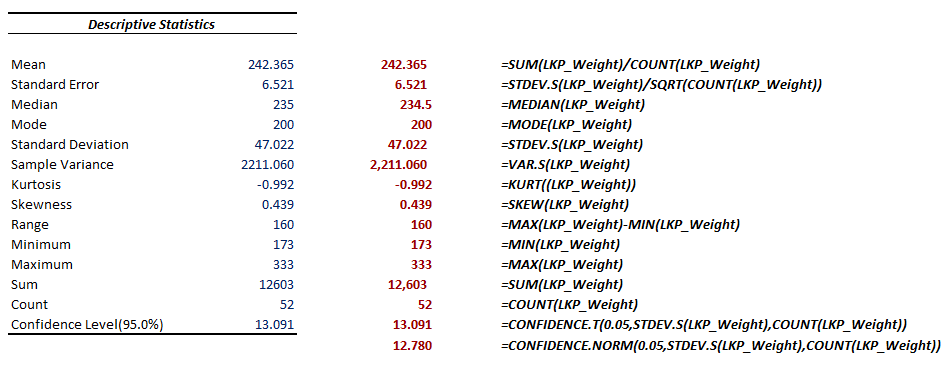
Back in August Microsoft made a momentous announcement of good ole’ Excel now supporting Python scripts (at least for those Office 365 subscribers who are part of the Beta Insider channel.) While this functionality brings an array of virtually unlimited possibilities to an already powerful tool, many analysts recognize that support for various statistical analysis techniques is one of the most promising areas to capitalize here. Having said that, some users do not realize that they don’t need to leverage sophisticated Python functions to conduct exploratory data analysis of their datasets – they can instead install Excel add-in called “Analysis Toolpak” to get them started on their statistical learning journey. In this post we will use this tool to analyze weight distribution of players appearing on the 2023/24 Chicago Bears Roster. These summary statistics will help us get a quick overview of this dataset, and in turn, make it easier for us to spot patterns and outliers. We will then recreate these capabilities via Excel functions and formulas.
Continue reading


