Table Joins

Understanding Table Joins in SQL

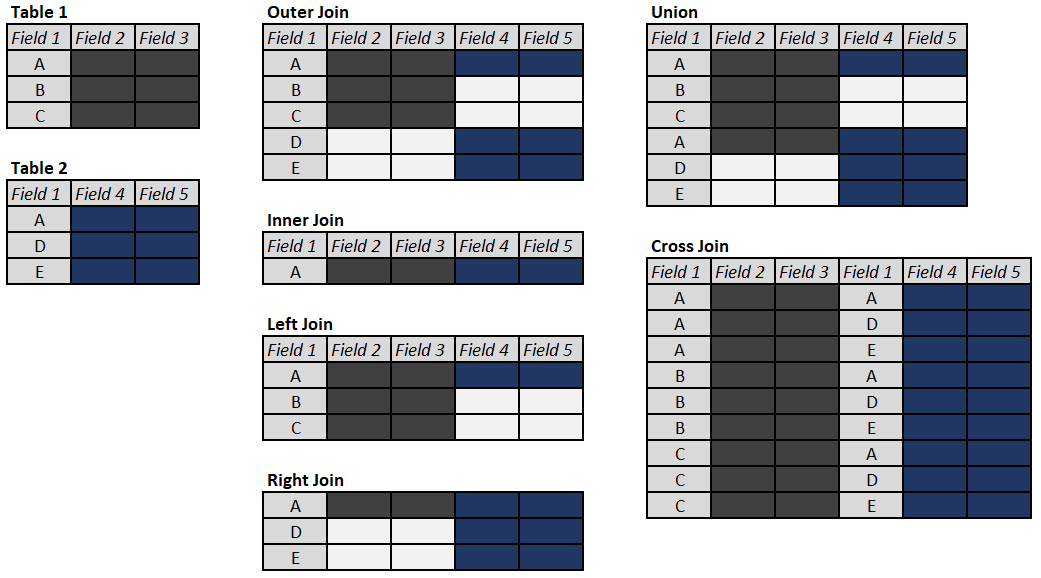
Working with data often involves the need to utilize multiple data sources, usually stored in different data tables (in case of database storage) or data frames (when it comes to programming languages or data visualization tools.)  In order to put power of this data to a good use we want to be able to join these tables based on a field or fields they have in common (foreign key[s]) or sometimes values in the field that are different. Not only basic principles of table joins – INNER, OUTER (FULL, LEFT, and RIGHT), CROSS (or Cartesian) or even UNION-ing tables are universal to most relational databases and flavors of SQL, they also apply to working with data frames. In this post we will explore examples of using these table joins in a PostgreSQL database, while adding SELF, and LEFT/RIGHT exclusive joins for a good measure.

Continue reading
 

A beginner’s Guide to BigQuery Sandbox and exploring public datasets.

A beginner's guide to BigQuery Sandbox

          As you might realize by now, writing SQL queries is one of the essential skills any inspiring data analyst needs to master. After all, larger datasets are typically stored in relational databases and Structured Query Language is the language that helps us communicate with such databases. Sure, NoSQL is gaining prominence amid the growing popularity of nontraditional databases, but we need to learn to crawl before we start walking. Merely 10 years ago, you would need to download and install a RDBMS software package (be it MySQL, PostgreSQL, or SQLite), load a sample database and do a hundred pushups before you could write your very first SQL query. Luckily technology sprung ahead and we now have a plethora of web-based SQL editor options from SQL Lite Online to SQL Fiddle that eliminate the software setup step, but might still require us to load sample data. What if you wanted to access real-world big data sets from the comfort of your browser without having to download any software, no hassle, no trial, no credit card required? Well, you’re in luck, what follows is the beginner’s guide to Google BigQuery’s Sandbox. An active Google account is your cost of admission. BONUS: Machine Learning models are powered by nothing else but SQL are also included.
Continue reading

How to pass an analytics job test – Part I – SQL.


How to pass an analytics job test - Part I - SQL

          With the demand in data analytics professionals growing stronger than ever, recruiters find themselves in a peculiar position of having to screen hundreds of potential, seemingly qualified candidates. Some firms turned to the proven selection tool: pre-employment skills assessments; and analytics-related tests are on the rise, especially for the junior level industry positions. No tests are the same, but most are designed with the sole purpose of gauging candidate’s cognitive ability to understand the problem at hand and having the technical know-how to implement a working solution. Two types of analytics tests that my students shared involved using either: Microsoft Excel or SQL language. Most of relational databases can be queried using a dialect of SQL, and as such, knowledge of SQL is as essential for a data analytics professional, as their excellent communications skills. In this post we will go through an example of a SQL job test, while in the next article we would focus on an Excel problem.

Continue reading

Working with sample datasets in BigQuery

Working with sample datasets in BigQuery

          In the previous post we added public tables to our BigQuery interface. However, Google already provides sample data on various topics by default. While most of these tables are not updated, they still present some interest in terms of learning trends or insights on a multitude of topics. We will focus on 3 of these tables:
Natality (daily US births from 1969 to 2008),
GSOD (daily weather information by a station number from 1929 to 2009),
and Shakespeare (word index of Shakespeare’s works.)

          Let’s start our exploration with the Natality dataset. The graph above charts share of teenager births, comparing to grand total by year. Between 1969, nominal number of births by teenagers went up from 307,561 to 441,110. However, this is not necessarily a bad news, considering growing US population. While in 1973, almost every fifth birth (19.55%) was by a teenager mother, by 2005 this ratio dropped to every 10th birth (10.18%.) To pull relevant source data, we simply need to run the following query (which would incidentally retrieve preteen births as well [outliers representing fewer than 200 births a year.]):
Continue reading